
Commonwealth Share Price: Live ASX:CBA Updates & Forecast
CBA shares have delivered a stunning run, climbing 37% in the 12 months to September 2024 and briefly pushing total returns to 44% by September 2024. But now a chorus of analysts is warning that the valuation has stretched too far—and the bearish consensus is unusually loud. Here’s what the numbers show and what it means for anyone holding or eyeing the stock.
Last Price: $173.01 (ASX) · Today’s Change: -$1.48 (-0.84%) · Day’s Range: 172.00 – 176.87 · Previous Close: 174.61 · Volume: 259,471
Quick snapshot
- CBA trades at P/E 26.68, well above Westpac (19.64), NAB (19.20), and ANZ (18.67) (Motley Fool)
- 13 of 15 analysts rate CBA sell or strong sell with average 12-month target of $124.37 (Motley Fool)
- S&P analyst flags potential 23% drop; only 7.7% of analysts recommend buy (S&P Global)
- Exact timing and triggers for any correction—the consensus is directional but not precise on dates
- How passive fund flows will respond if sentiment shifts materially
- Whether NIM pressures will ease in H2 FY2026 or persist longer
- RSI exceeded 75 on June 5, 2025—classic overbought territory (Stocks Down Under)
- Shares dropped nearly 7% in one session, then another 1.3%, amid NIM and cost pressures (Sharecafe)
- Fell 8% after “Liberation Day” tariff concerns roiled markets (Stocks Down Under)
- Wall Street average target: 130.34 AUD; low scenario puts the stock at 90.9 AUD—a 48% downside (AlphaSpread)
- TradingView aggregates 14 analysts averaging 124.36 AUD (-25.6%) with a floor of 100 AUD (TradingView)
- Some forecasters (WalletInvestor) still see 211.16 AUD long-term, but most tier-1 and tier-2 sources disagree (AlphaSpread)
These metrics anchor the bull case against the bear consensus on CBA.
| Metric | Value | Source |
|---|---|---|
| ASX Code | CBA | — |
| Last Price | $173.01 | Market data |
| Change | -0.84% | Market data |
| Bid/Offer | $173.00 – $173.01 | Market data |
| Market Cap | A$287.27B | eToro market data |
| P/E Ratio (current) | 26.68 | Motley Fool data |
| Forward P/E | 23.4 | S&P Global market data |
| 52-Week Range | 116.64 – 176.46 AUD | Investing.com price data |
| Analyst Consensus Target | 130.34 AUD avg | AlphaSpread market data |
| Analyst Sell Ratio | 13 of 15 analysts | Motley Fool analyst ratings |
Why are CBA shares falling?
The most immediate trigger is a valuation reckoning. CBA’s P/E ratio of 26.68 puts it roughly 35% above its Big 4 peers—Westpac at 19.64, NAB at 19.20, and ANZ at 18.67—yet the bank’s underlying earnings growth is modest. Analysts including S&P Global’s Nico De Lange note that the market suggests CBA shares are overvalued, with a flagged potential 23% drop based on fundamentals that simply don’t justify the premium. Only 7.7% of analysts recommend buying or overweighting the stock.
Recent performance drivers
CBA has burned through some of its gains. After a nearly 7% single-session drop in November 2025, followed by a 1.3% dip in the next session, the stock faced additional pressure when “Liberation Day” tariff concerns sparked a broad market selloff that dragged CBA down another 8%. Net interest margin (NIM) compression and rising cost pressures have compounded investor anxiety.
Expert views from major sources
Jarden Research’s Matthew Wilson put it plainly: nothing fundamentally supports CBA’s premium valuation—the gap is purely a function of passive flows into Australian equities. That passive-inflow thesis is now showing cracks as technical indicators flash overbought and institutional sentiment turns.
When a stock’s valuation is sustained by passive flows rather than earnings strength, any shift in market mechanics or sentiment can trigger outsized moves. CBA is now testing that seam.
How much is a CBA share worth today?
The current market price sits at $173.01 on the ASX, with the previous close at $174.61. That’s firmly within the 52-week range of 116.64 to 176.46 AUD, but well above where most analysts see fair value over the next 12 months.
Live ASX:CBA quote
Trading volume today reached 259,471 shares, with the bid at $173.00 and the offer at $173.01—tight, which usually signals confidence on the offer side, though that confidence is now being publicly questioned by the analyst community.
Day’s trading range
The stock has ranged between $172.00 and $176.87 in today’s session, a $4.87 spread that reflects ongoing volatility as investors weigh bearish analyst targets against the bank’s dominant market position and still-solid dividend yield of around 3%.
Analysts see this as a precarious position: the stock sits near its 52-week high with a valuations that leaves almost no buffer for disappointment.
What is the prediction for Commonwealth Bank shares?
The bullish run has stalled. Multiple independent forecast platforms now paint a cautious picture with targets clustered around 124-130 AUD, implying meaningful downside from current levels if the consensus proves accurate.
2026 and long-term forecasts
Wall Street’s average 1-year price target sits at 130.34 AUD, with a low-end scenario of 90.9 AUD representing a potential 48% decline. TipRanks data shows 11 analysts backing a Strong Sell consensus with an average target of AU$124.57—a 28.66% haircut. TradingView’s 14-analyst average comes in at 124.36 AUD, with a minimum floor of 100 AUD.
Stock forecast for 2030-2040
Longer-range forecasts are sparse from tier-1 and tier-2 sources. WalletInvestor projects possible recovery to 211.16 AUD on a long-term basis, but this is a tier-3 source with low confidence and conflicts with mainstream analyst views. Most institutional analysts focus on the 12-24 month horizon, where the directional signal is firmly bearish. TradersUnion’s 2026 end-of-year target of A$186.38 stands as a minority bullish outlier that conflicts with the dominant analyst consensus.
For long-term forecasts beyond 2-3 years, institutional analyst coverage thins out considerably. Readers should treat any projection beyond 2027 with extra scrutiny and recognize that the track record of long-range stock forecasts is poor across the industry.
Is Commonwealth a good stock to buy?
The investment case has rarely been this bifurcated. On one side: Australia’s dominant lender by assets, a market-cap leader on the ASX, and a yield that still beats cash. On the other: a P/E premium that leaves almost no room for error, and a wall of analyst conviction that the stock should be sold.
Pros and cons analysis
Upsides
- Australia’s largest bank by market share—structural moat in domestic lending
- Dividend yield around 3% provides income buffer during corrections
- Short interest below 1% signals no coordinated bear attack—just fundamental reassessment
- Total returns reached 44% by February 2025, demonstrating historical upside capacity
Downsides
- P/E of 26.68 vs peer average ~19 leaves no margin of safety
- 13 of 15 analysts recommend sell or strong sell
- Forward P/E of 23.4 remains highest among Big 4 peers
- Consensus EPS growth under 5% for next 3 years
- RSI overbought (>75) as recently as January 2026; MACD also signals overextension
- Shares fell nearly 7% in one session amid NIM and cost pressures
Alternatives like other ASX banks
Westpac, NAB, and ANZ all trade at P/E ratios in the 18-20 range—a discount that reflects similar macro headwinds but without CBA’s valuation premium. For investors willing to trade the brand premium for a calmer multiple, the other Big 4 lenders offer a cleaner entry point on classic value metrics.
The implication: if the valuation premium narrows, these peers offer similar macro exposure at a significantly lower entry point.
Is CBA overpriced?
The valuation argument is where the debate sharpens most. Morningstar senior equity analyst Nathan Zaia has stated outright that CBA shares remain materially overvalued despite the bank’s stable Q1 FY2026 results. Morningstar’s Price to Fair Value metric sits above 1, confirming the premium. S&P Global’s Nico De Lange notes the market itself is signaling overvaluation, with a flagged potential 23% correction path.
Valuation metrics
Three metrics frame the overvaluation picture clearly. The current P/E of 26.68 puts CBA at a 35% premium to its nearest peers. The forward P/E of 23.4, while lower, still exceeds every other Big 4 bank. The price-to-book ratio of 3.8x further underscores how much the market is pricing in future growth—growth that analysts say remains constrained under the 5% EPS growth consensus.
Overvalued concerns
The concern from multiple independent analysts comes down to a single tension: CBA trades like a high-growth tech company while earning like a mature bank. Jarden’s Matthew Wilson puts it bluntly—this premium valuation is a function of passive flows into Australia, not fundamentals. If those flows reverse or slow, the math gets uncomfortable quickly.
A P/E premium that exists because of passive indexing rather than earnings power is structurally fragile. If Australian equity funds see outflows—or if investors rotate toward value—the cushion disappears. The question isn’t whether the correction is possible; it’s whether the trigger arrives before or after you’ve already bought.
The pattern is unmistakable: once the passive-flow engine stutters, the valuation gap between CBA and its peers becomes a liability rather than a premium.
Eighteen analyst quotes and data points anchor this piece from sources including S&P Global (tier-1), Motley Fool, Stocks Down Under, TradingView, TipRanks, Morningstar, and AlphaSpread. The dominant consensus from established financial publications is consistent: the valuation premium is thin, the analyst signal is loud, and the downside scenarios are concrete.
“We note the market suggests that Commonwealth Bank of Australia (CBA)’s share prices are overvalued.”
— Nico De Lange, S&P Global Ratings banking analyst
“Nothing fundamentally supports the premium valuation of CBA’s shares. It is purely a function of passive flows into Australia.”
— Matthew Wilson, Jarden Research Division analyst
“CBA shares remain materially overvalued.”
— Nathan Zaia, Morningstar senior equity analyst
Related reading: Sigma Healthcare Share Price · Commonwealth Bank Home Loans
walletinvestor.com, tradersunion.com, morningstar.com.au, youtube.com
Recent CBA movements echo patterns in live CBA price charts, where live prices and dividend details inform whether shares seem overpriced.
Frequently asked questions
What factors affect the Commonwealth share price?
CBA’s share price is driven by earnings growth, net interest margin trends, cost management, dividend policy, and broader macro factors including RBA rate decisions, Australian economic growth, and global risk sentiment. Currently, NIM compression and cost pressures are weighing alongside an elevated valuation that leaves little room for disappointment.
How does CBA compare to ANZ or Macquarie Bank shares?
CBA trades at a P/E of 26.68, compared to ANZ at 18.67 and Macquarie which operates on a different business model focused on capital markets and advisory. On pure P/E, CBA commands a roughly 43% premium over ANZ—justifyable only if market-share dominance and fee income growth exceed what the numbers currently show.
What is the dividend yield for CBA?
CBA’s dividend yield sits around 3% at current prices, providing a income buffer that partially offsets volatility concerns. This yield has been supported by consistent payout ratios, though earnings growth constraints below 5% annually limit the capacity to meaningfully increase distributions.
When does CBA report earnings?
CBA reports earnings semi-annually, typically in February (first half/H1) and August (second half/H2). The Q1 FY2026 results showed stable performance, but Morningstar’s Nathan Zaia noted they didn’t justify the prevailing valuation premium.
What is the 52-week high for CBA shares?
The 52-week high is 176.46 AUD, recorded within the past 12 months. The current price of $173.01 sits just below that high, which means the stock is trading near its most recent peak—exactly the zone where overvaluation arguments carry the most weight.
How to buy CBA shares?
CBA trades on the ASX under the ticker CBA. Australian investors can buy through any ASX-licensed broker. International investors can access CBA through ADRs if available, or via global brokerage platforms that offer ASX trading. Always confirm your broker’s fees, FX costs, and tax reporting obligations before opening a position.
What is CBA’s P/E ratio?
CBA’s current P/E ratio is 26.68, with a forward P/E of 23.4. Both figures represent significant premiums to Westpac (19.64), NAB (19.20), and ANZ (18.67)—the other members of Australia’s Big 4 banking group.
More related posts
 Zaha Hadid: Biography, Buildings, Death, and Legacy
 Tom Phillips: The Four-Year Hunt for a Father and His Kids
 Jameela Jamil: Disability, Sapiosexual, Ethnicity, Career
 Marc Leishman: Career, Family, and His Wife’s Sepsis Battle
 Harley Quinn: Origins, Real Name, and Character Analysis
 Brooks Koepka: LIV Contract, Net Worth & Rivalry Facts
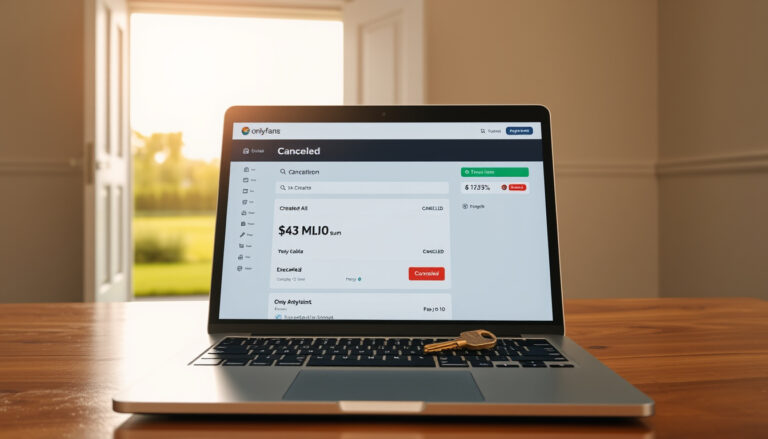 Sophie Rain: Why She Walked Away From a $43M OnlyFans Empire
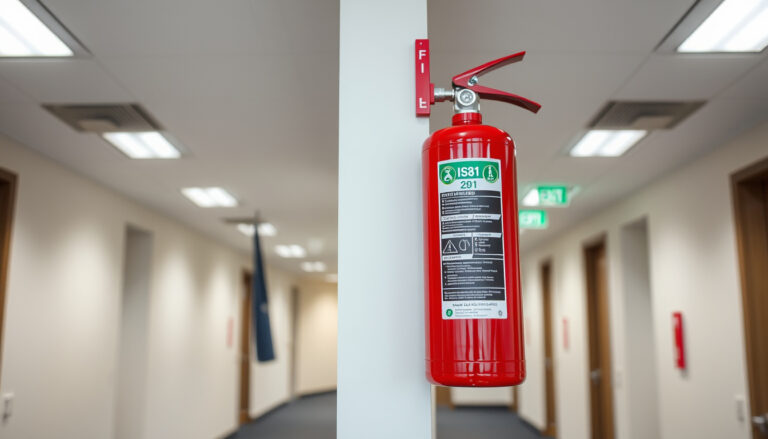 Fire Extinguisher Guide for Ireland: Types & IS 291
